
Clutch Data Expected Points: A New Standard in Performance Analysis
How Clutch Data’s New Expected Points Metric Uncovers Team and Player Efficiency in Scoring Across Leagues


At Clutch Data, we've developed a groundbreaking metric tailored for the Euroleague and adaptable to any FIBA league: the Clutch Data Expected Points (CD xP). This innovative metric predicts the potential points for each shot, accounting for various factors that influence scoring outcomes.
By analyzing each attempt, CD xP gives teams an advanced measure of both offensive and defensive efficiency, revealing hidden insights into shot selection, player skill, and overall game strategy.

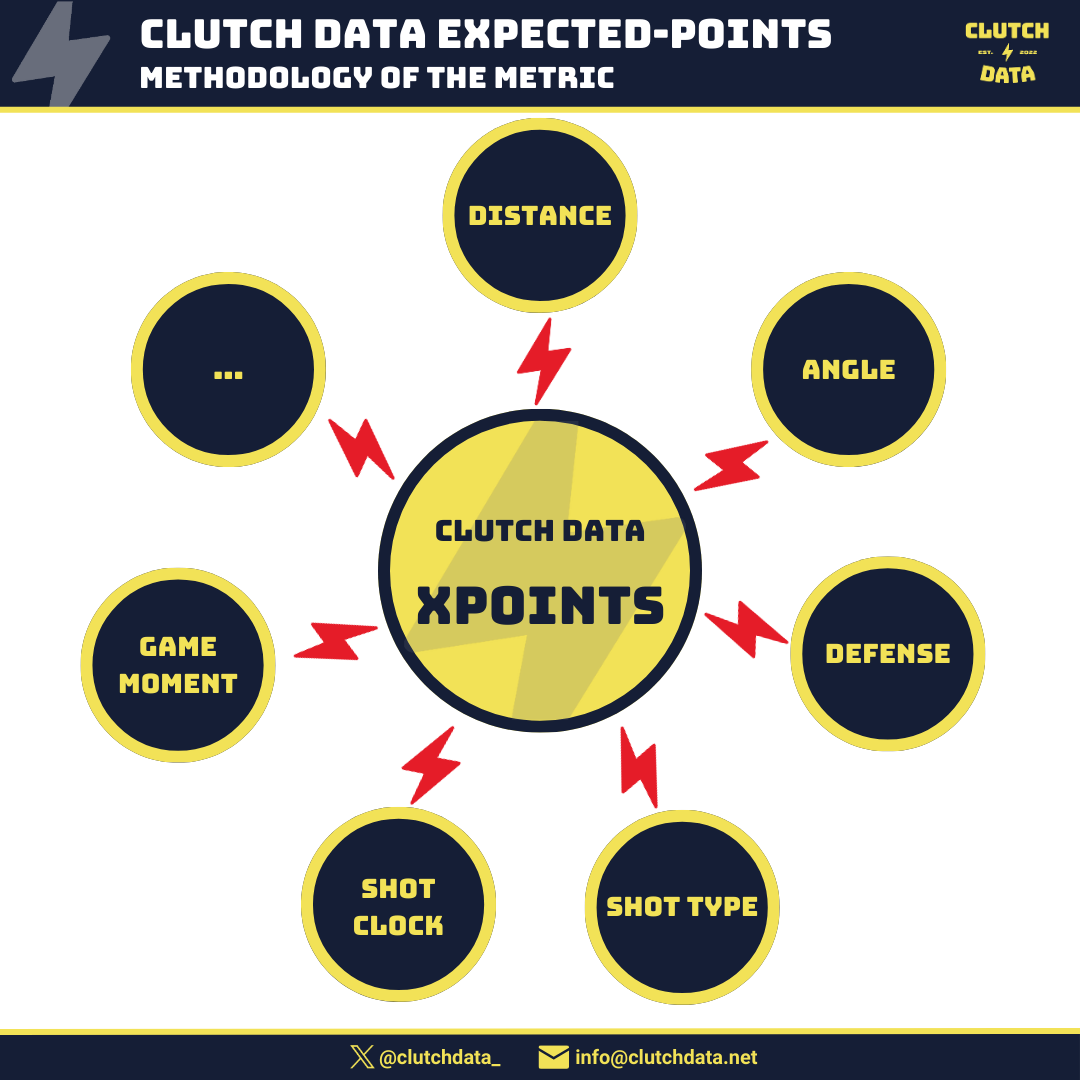
1-How We Calculate Clutch Data xP
CD xP incorporates crucial shot variables such as distance, angle, defensive proximity, shot type, remaining shot clock, game context, and more. This allows us to precisely calculate expected scoring for every shot and provides an adaptable tool for analysis across all leagues.
2-Applications of Clutch Data xP in Euroleague 2024-25
2.1 Expected Points per Team
After the first 8 rounds of the Euroleague season, we can see the average CD xP per game for each team.
For instance, Paris Basketball leads with 87.7 CD xP per game, contrasting with their actual average of 82.8 points. This negative difference might indicate inefficiencies, potentially due to open shots missed or players not optimally suited for certain shot types for example.
Conversely, FC Barcelona shows a positive differential with 84.6 actual points against an expected 80.4, suggesting their strong shooters can convert challenging shots.
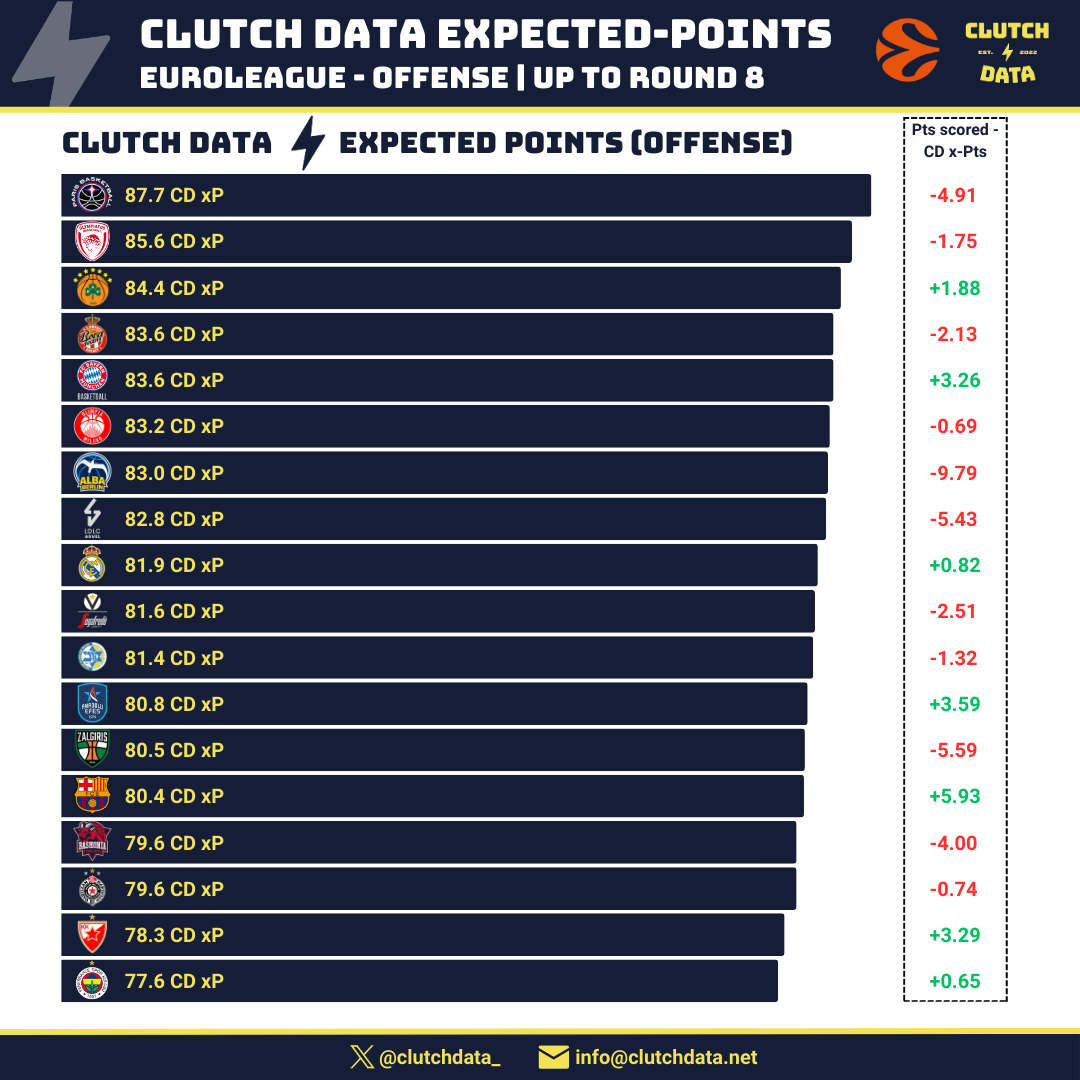
This analysis extends to defense as well, revealing insights into CD xP allowed, or can be further refined by shot location (e.g., paint, three-point corner shots), shot type, and even game phase (e.g., clutch moments).
2.2 Clutch Data xP for Players
Players also shine under CD xP.
Carsen Edwards leads with 20.0 xP per game, followed by TJ Shorts (17.6), Sasha Vezenkov (16.7), Toko Shengelia (16.0), and Kendrick Nunn (15.7), showcasing their significant shot potential each game.

2.3 Top 5 Players in Difference Between Real and Expected Points
Beyond expected scoring, CD xP highlights players who consistently exceed their expected points.
Kevin Punter, for instance, averages 3.87 points above his xP per game, reflecting elite shot-making abilities. He is followed by Shabazz Napier (+2.51), Dovydas Giedraitis (+2.48), Jan Vesely (+2.35), and Rodrigue Beaubois (+2.14).

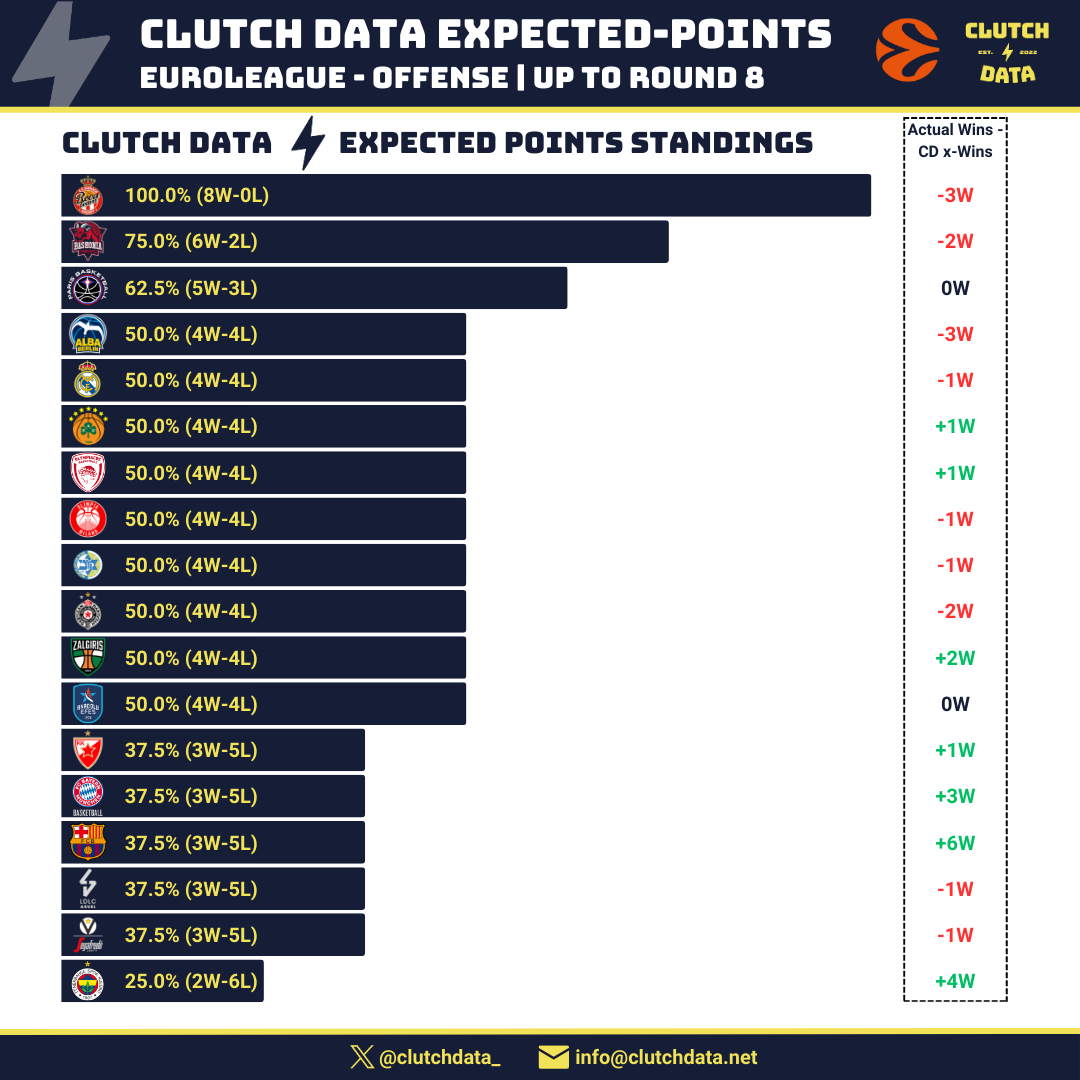
2.4 Standings Based on Expected Points
CD xP provides a unique view of the standings. If games were determined by expected points, AS Monaco would lead the Euroleague, undefeated. Remarkably, teams like Baskonia and Alba Berlin would rank higher, while Fenerbahce, who has exceeded expectations by winning four more games than projected, would place last.
Conclusion
The Clutch Data xP metric is transforming how we understand efficiency and performance in professional basketball. By identifying not only scoring potential but also the capacity to outperform expectations, CD xP empowers teams with insights that go beyond traditional statistics. As this metric continues to gain traction, we look forward to seeing its impact on Euroleague strategies, leagues, and player development.